
Huge month with three marquee features! The Listings Marketplace is officially live where TractIQ brokers highlight their listings directly on the platform, a new On-Market signal was added that allows investors to prospect for facilities that public signals indicate are likely on the market, and an entirely new way to analyze rates was launched.
Featured Update: Listings: The Marketplace Is Here
This is the big one. TractIQ is now a two-sided marketplace. Brokers can put their facilities directly in front of the owners, investors, and operators who are already in TractIQ every single day, and buyers can seamlessly prospect for that inventory.
If you're a broker: list where the buyers already are
We want TractIQ to have the highest quality listings so we are making this opt-in for brokers. You must reach out to support@tractiq.com to register with us and get access to add your listings.
- Add a listing straight from your dashboard (Create → Add New Listing).
- List a single site or a full portfolio on one listing.
- Bring in co-brokers from your organization.
- Tell the story. Free-form Description and Investment Highlights fields, plus a Summary block for net rentable square footage, occupancy, NOI, and the rest of your figures.
- Upload your OM, drop in a cross-listing URL to your own site, and attach photos and supporting docs like rent rolls, occupancy stats, and P&Ls.
- Decide what trade area you want this listing analyzed in
- See how your listing is landing. My Listings now shows saves, views, unique viewers, analyses, and OM downloads. No viewer identities are ever exposed, and your own org's activity is filtered out so you're only seeing real market interest.
What makes this different from other listings products? This is tailored specifically to self storage so you can draw key distinctions (e.g. between physical, unit, or economic occupancy). You can also influence the first-look investors will have in the market by deciding what the trade area is if a standard 1, 3, 5 mile radius doesn’t really make sense.
If you're a buyer or investor: find what's actually on market
- A new Listing Status filter in prospecting gives you a three-way pick: TractIQ Listing (added directly by a broker), Likely On Market (public signals suggest the site is for sale), and Off Market (no detected listing activity). Build a list of on-market inventory exactly the way you build any prospect list.
- Color the map by listing status to spot opportunities at a glance using the new “Beta Pins” mode.
- Open any listing to see the brokers, asking price, description, investment highlights, photos, and documents, then reach out. For actively listed facilities, owner contact is replaced with a direct line to the listing broker.
- Save a listing as a deal right from the analyze panel to jump straight into analysis.
Custom Rate Analysis Charts
The most powerful way to analyze rates and visualize rates. The Rate Analysis page allows you to break down with granularity basically any way you want to look at current rates or trends going back to 2018. It’s designed for maximum power and flexibility so you can do the analysis you want. Whether you need to understand how a single facility or operator handles rates in a market, build a custom comp set on on a deal, or compare how various operators compare to each other in a market, you can do it in the Rate Analysis page.
Whatever custom breakdown you create, you can export it and bring it smoothly into Excel or wherever you want to build your full model.
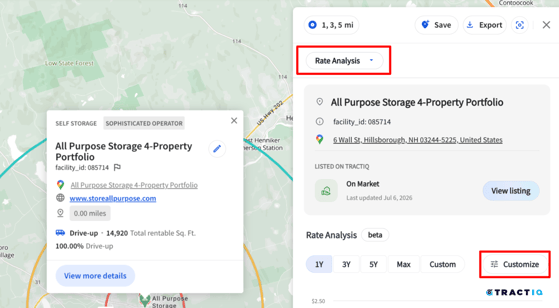
- Find it in the insight panel. Drop a pin, enter an address, or select a facility, open Rate Analysis, and hit Customize to open the full builder on its own page.
- Slice rates any way you need: street rates vs. web rates, by month or year, broken down by unit size, climate control, level and access, management type, facility size, or individual facilities.
- Build custom groups (e.g. compare 10x10 CC for all CubeSmarts vs Extra Space facilities in a market) to benchmark head-to-head.
Reports & Exports
- The occupancy export now behaves like every other report. It pulls and separates all available radii and gives you a clearer message when a market genuinely has no data.
- Income statement exports are now labeled by year (for example, "Income Statement (2025)").
- Bugfix: Storage Facilities data exports are ordered by distance.
Reliability & polish
- "Select all" across a filter is noticeably faster in the dashboard.
- You can now add an optional phone number, photo, and role (broker, investor, etc.) to your profile.
New, Updated, and Removed Development Sites:
|
New Developments |
Updated Developments |
Removed Developments |
|
1,058 |
142 |
792 |
New, Updated, and Removed Facility Count:
|
New Facilities |
Updated Facilities |
Removed Facilities |
|
65 |
1,508 |
24 |